In this life nothing is certain. Therefore I am not declaring, absolutely, that we are at peak oil, only that it is a near certainty. But I am putting my reputation on the line in making the claim that the period, September 2014 through August 2015 will be the year of Peak Oil. Below are my reasons for making this claim.
First of all, Peak Oil is not a theory. The claim that Peak Oil is a theory is more than a little absurd. Fossil hydrocarbons were created from buried alga millions of years ago and they are finite in quantity. And as long as we keep extracting them in the millions of barrels per day, it is only common sense that one day we will reach a point where their extraction starts to decline. In fact most countries where oil is extracted are already in decline. So obviously if individual countries can experience peak oil then the world as a whole can also experience peak oil.
All charts below are in thousand barrels per day of Crude + Condensate with the last data point September 2014.
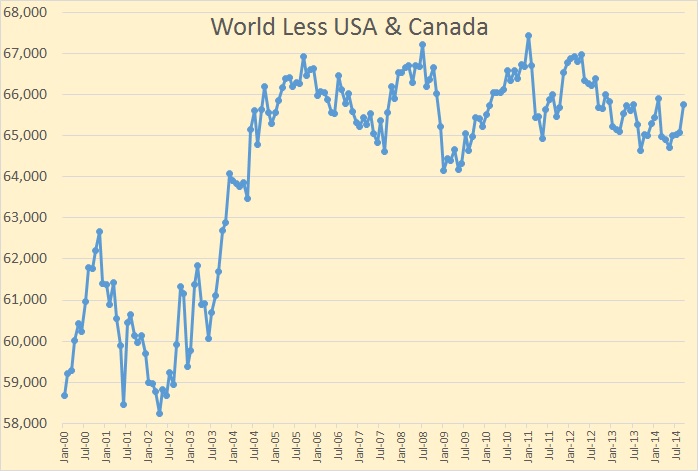
First I want to deal with the portion of the world that reached peak oil about four years ago, in January 2011. That is everywhere else in the world except the US and Canada. I am not saying that every country outside the US and Canada has reached peak oil, but combined they have reached peak oil
The world outside the United States and Canada has been on a bumpy plateau for ten years now and now, even with that last September 2014 surge, is still 1,670,000 barrels below the peak of January 2011. However only a few countries is responsible for this plateau.
The bumpy plateau actually began back in 2005 where the peak was in July. Since them, outside the USA and Canada, there have been 15 countries with production increases and 21 countries with production declines. Here is a look at the 15 winners outside the US and Canada.

Dealing with the winners one at a time:
Iraq: The EIA has data only through September but Iraq has actually increased production by about 300 kbd to December. but word is they are slightly down in January. That puts Iraq up almost 1.5 million barrels per day since they started their massive infill drilling program in 2009. Iraq still has some upside potential but their downside risk now even greater.
Russia: Russia has peaked, even according to Russian analyst. They will decline only slightly in 2015 but their decline will accelerate after that.
Brazil: Brazil has some upside potential and a lot of downside potential. The finances of Petrobras are a damn mess. Moody’s has downgraded them to Baa3, just one notch above junk status and further downgrades is expected soon. To increase their pre-salt production much more will require a lot more borrowed money. That is not very likely.
Qatar: The EIA says Qatar C+C production increased by 598,000 barrels per day between July 2005 and September 2014. The OPEC Monthly Oil Market Report says their crude only production declined by 78,000 barrels per day during that time span. The chart above was made with EIA data which counts condensate as oil. OPEC reports only crude. On the char below the EIA data is through September, the OPEC data is through December 2014.
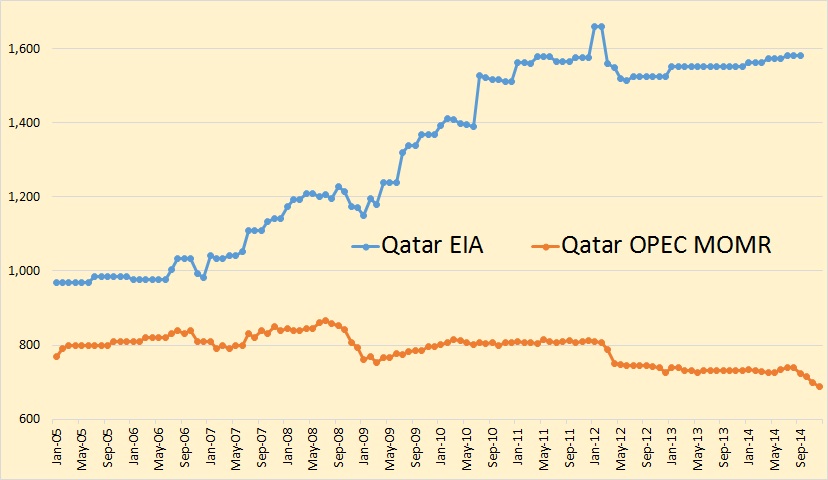
The EIA says Qatar has increased condensate production from her massive natural gas fields. Qatar crude oil production is in decline and has been since 2008. Qatar crude will continue to decline and their condensate is likely at a peak also.
Angola: Angola peaked in 2009 and 2010 and is now in decline. However some of the decline is caused by political problems. Those problems will likely get worse.
Colombia: Colombia’s production has doubled in the last 8 years but they reached their peak in 2013 and have held almost flat for the last two years. Colombia has peaked and will decline, though that decline will likely be very slow. I have included Colombia in the chart below that shows four countries that have recently peaked.
Kazakhstan: Kazakhstan is at peak of currently producing fields. Production will likely decline until Kashagan comes on line sometime in 2017. This field that once promised to produce over a million barrels per day is now expected to barely produce 300,000 barrels per day… if it ever manages to come on line. But nothing spectacular is expected out of Kazakhstan, especially since its old fields are expected to start to decline soon.
China: China peaked in 2010 and has held pretty well steady since then. I expect China will start to decline soon.
Azerbaijan: Azerbaijan peaked in 2010 and has been in steady decline since.
UAE, Oman and Kuwait: All three of these Middle East countries have implemented massive infill drilling programs in the last decade or so. But all three have now peaked. These three nations, along with Colombia, show a beautiful increase in production then a rounding peak at the top.
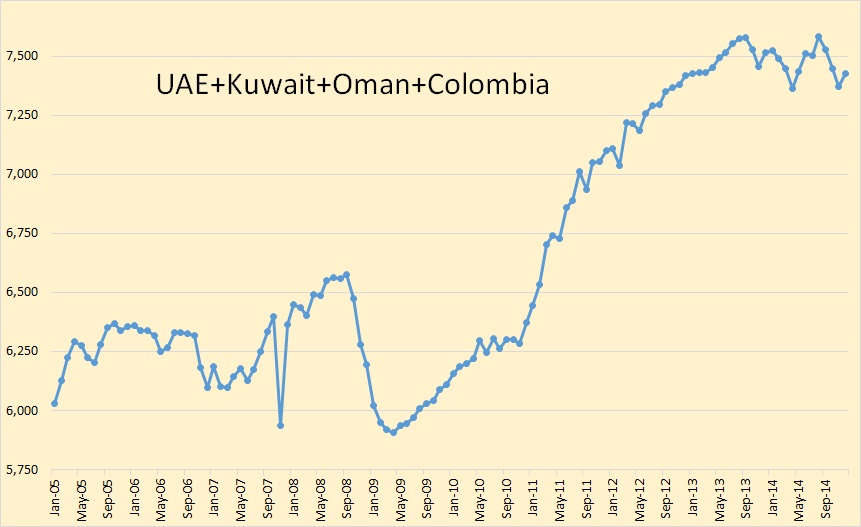
These four countries are responsible for 1.5 million barrels per day of the increase since 2005. They have all four now peaked, or at least very near their peak.
Saudi Arabia: Saudi has brought their last mothballed field on line, Manifa. Now they have none. Saudi is producing flat out. They might, with great effort, produce a few more barrels per day, but basically they are at peak right now.
And a look at the 21 losers.
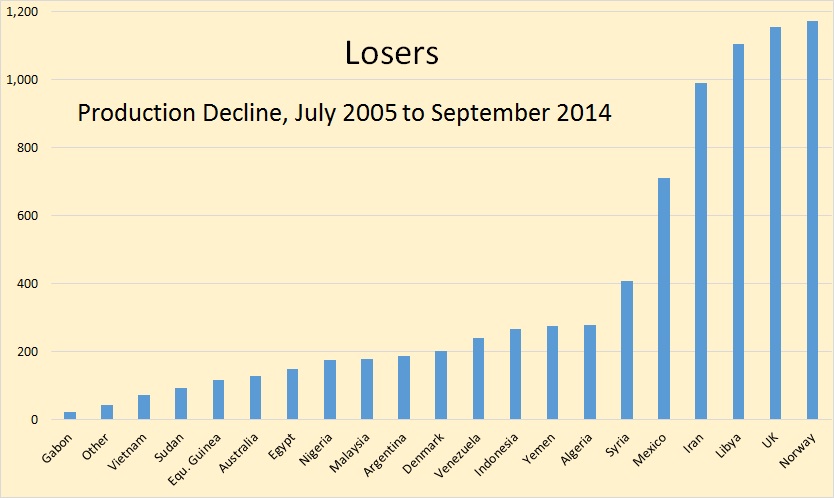
I have changed the negative numbers to absolute numbers in order to make it easier to read. But basically these are the nations that have peaked and are now in decline. A couple, Iran and Libya, because of political problems, have declined a lot more than they would have without that conflict. However neither is likely to recover very soon. And even when they do, it will be to a point lower than they were before their problems. Syria and Sudan, including South Sudan, and Yemen are others that will not recover in this decade, or until long after we are on the down-slope of peak oil.
That brings to the US and Canada.
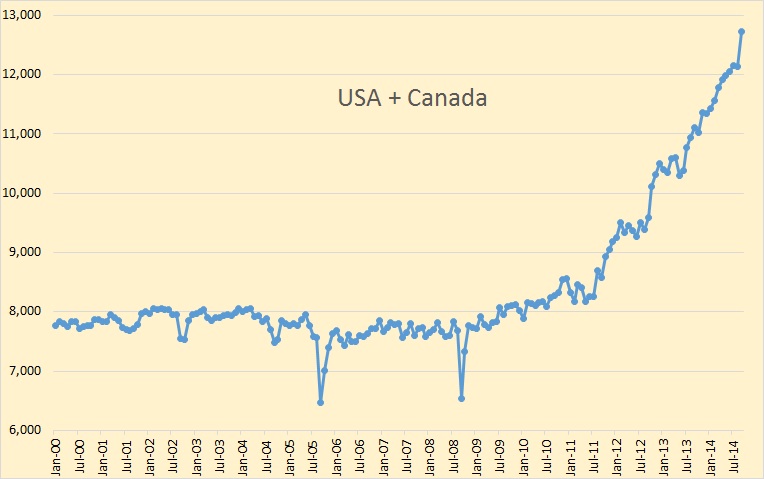
The USA and Canada are responsible for about 120% of the increase in world oil production since 2005, even though they did not begin their grand ascent until 2009. Canada’s over 400,000 bpd increase in September is responsible for that last spike upward. But can this continue?
In a word… no. The gain has been almost all LTO and oil sands. And low prices are killing both. If prices stay low both Canada and the USA will begin to decline by the second half of this year. But even if prices return to the $70 ti $80 range, (it is not likely they are going higher than that), their production will still not increase fast enough to offset the decline in the rest of the world.
But what about those massive reserves still in the ground? Many say we have not yet produced half the URR, the Ultimate Recoverable reserves, and until we are at least that half way point, we cannot be at peak oil. Well, there are a few really serious problems with that logic. First, what is meant by the word “recoverable”? And at what price? Let’s look at really important chart.
The 2014 data point on the chart below is the average January through November.
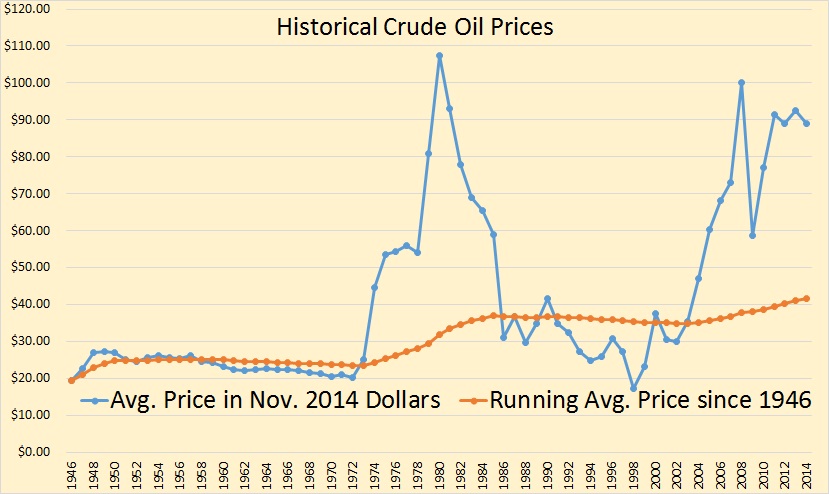
Here is a chart of Historical Crude Oil Prices. The average price, the blue line, is the average price of oil for that year. The orange line is the average price from 1946 to any point on that line. For instance the average price of oil for the 34 years from 1946 through 1973 was $23.68. And that in today’s dollars. From 1946 through 1973 oil companies were getting an average of $23.68 a barrel for their oil, and they were making a pile of money at that price. Today, the price is more than twice that amount, and many of them are losing a pile of money.
So let’s get back to reserves. The reserves produced in 1973 and prior years was very profitable at less than $24 a barrel. Then all hell broke loose in the Middle East and prices skyrocketed. Then for the next dozen years oil companies made windfall profits. But in 1986 oil prices came down to normal. Between 1986 and 2002 oil prices averaged $30.42 a barrel. (Not shown on the chart.) Even at that price oil companies still made huge profits. But today they are losing money at $50 a barrel.
The problem is with those “reserves”. Today’s reserves are just not the same as those earlier reserves. All the good cheap stuff has already been sucked up. We are now left with dredges at the bottom of the barrel.All today’s new oil is harder to find, depletes a whole lot faster, and cost many times as much to produce. None of the cheap stuff is left except in a few old super giant fields that are undergoing infill drilling like there is no tomorrow.
Once again, we are at peak oil right now. The peak will straddle the 2014 and 2015 time line. 2016 will be the first full post peak calendar year. It really doesn’t matter how many barrels of oil is left in the ground. The point is we will never again pull it out of the ground at the same rate we are pulling it out right now.
_______________________________________
No comments:
Post a Comment